Upwelling Indices for the U.S. West Coast
The Coastal Upwelling Transport Index (CUTI, pronounced “cutie”) and the Biologically Effective Upwelling Transport Index (BEUTI; pronounced “beauty”) leverage state-of-the-art ocean models as well as satellite and in situ data to improve upon historically available upwelling indices for the U.S. west coast.
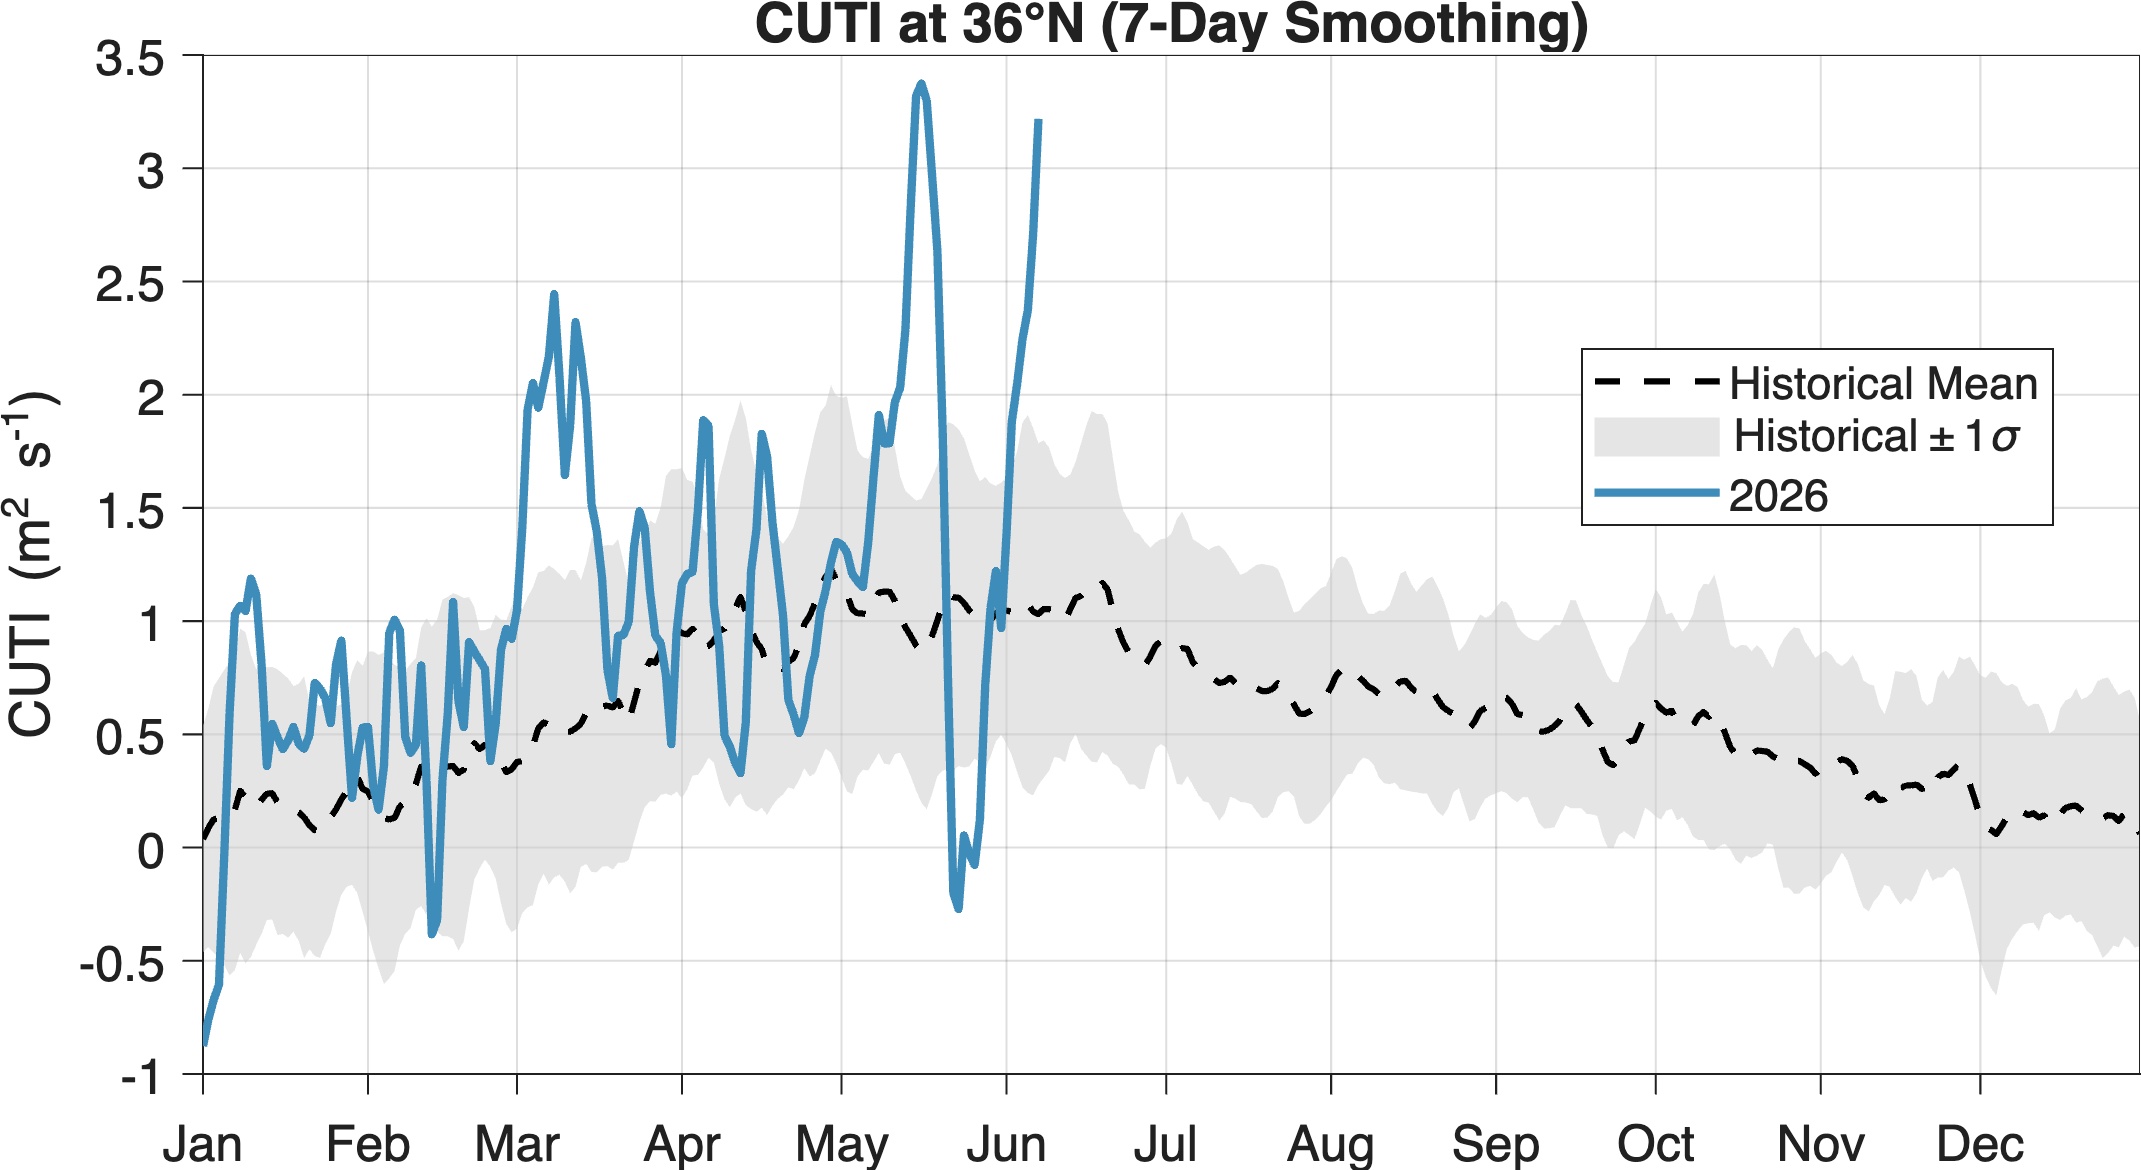
CUTI provides estimates of vertical transport near the coast (i.e., upwelling/downwelling). It was developed as a more accurate alternative to the previously available ‘Bakun Index’.
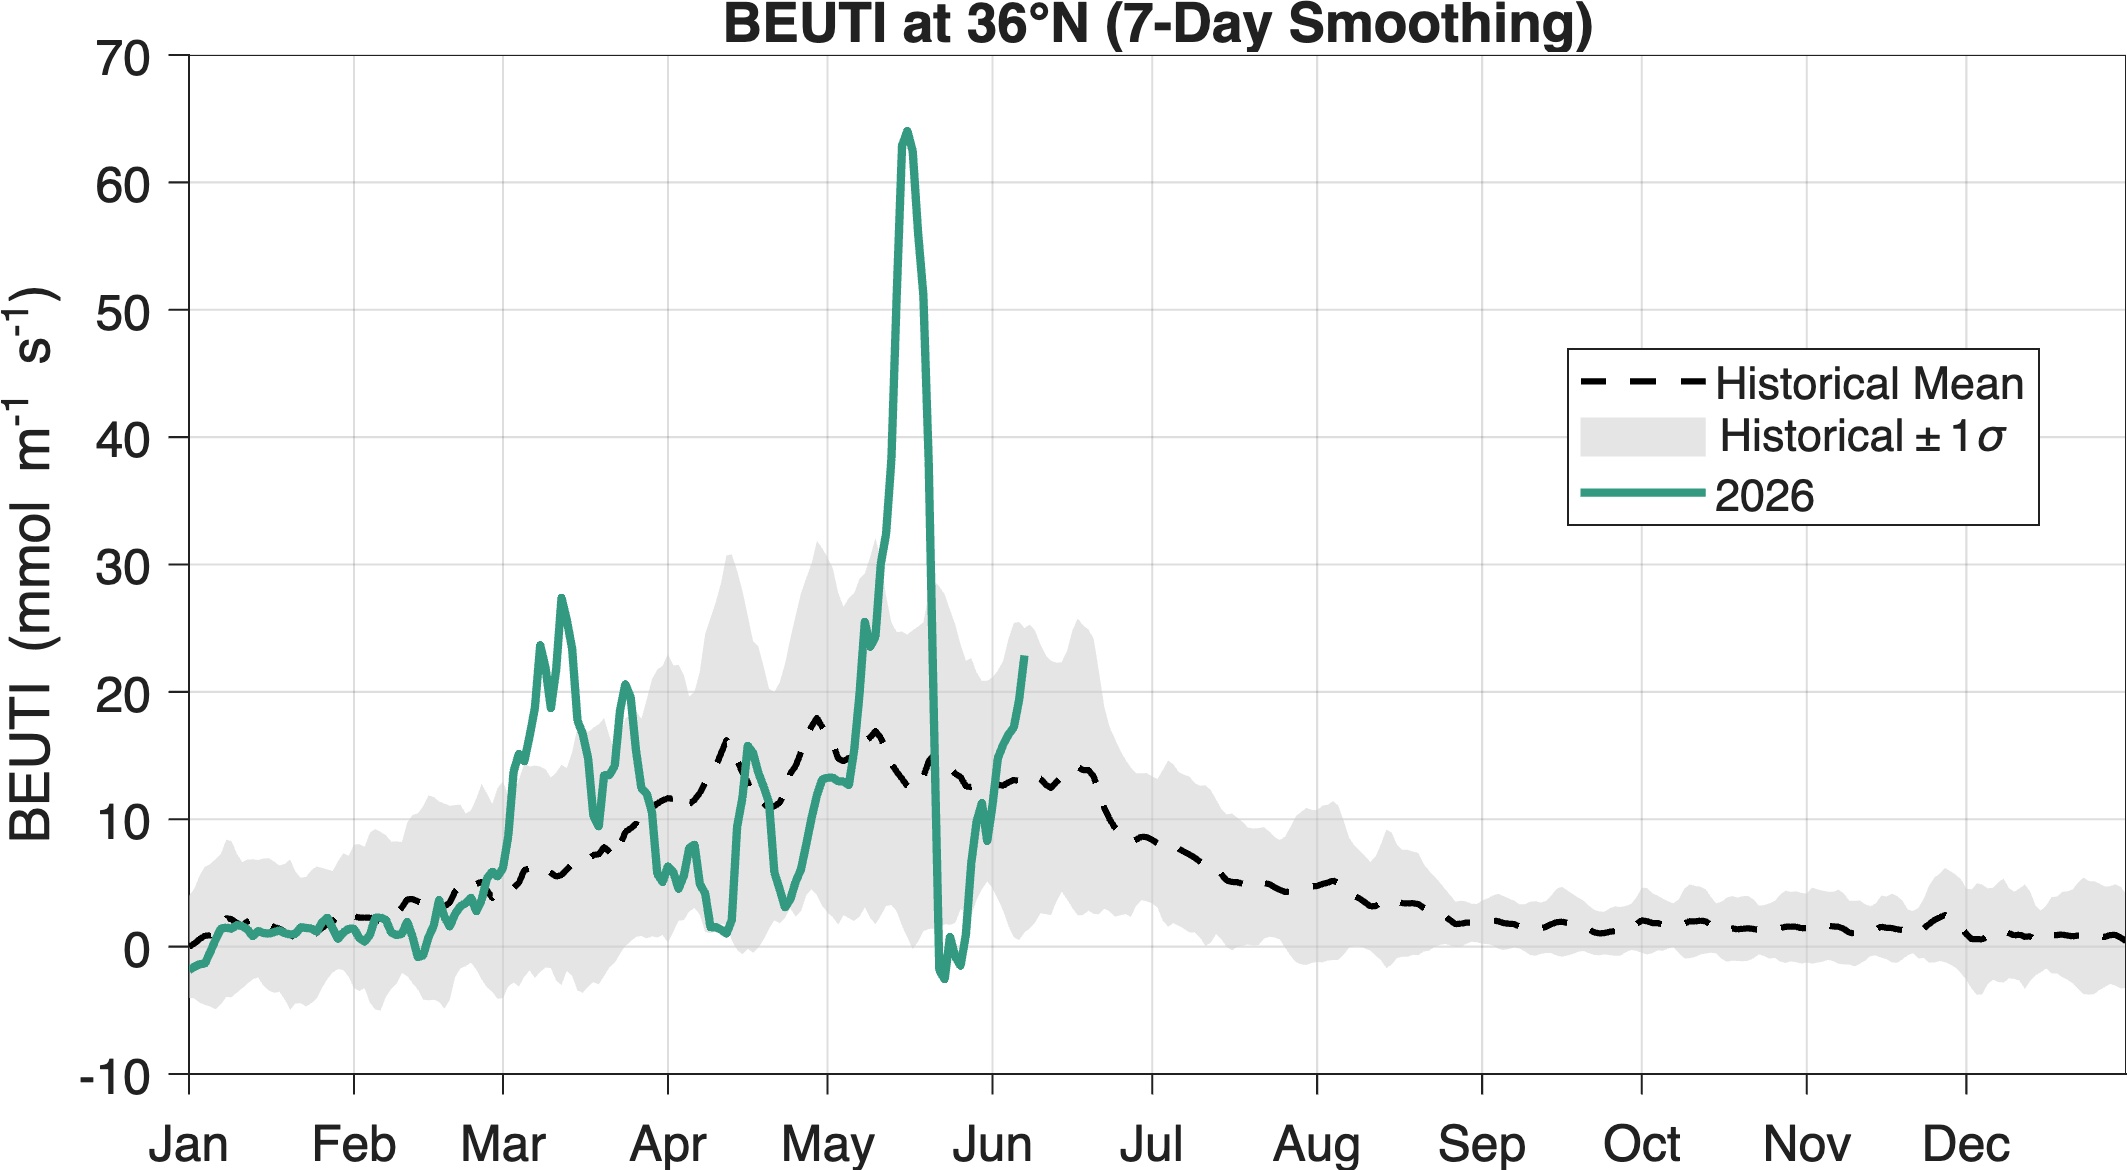
BEUTI provides estimates of vertical nitrate flux near the coast (i.e., the amount of nitrate upwelled/downwelled), which may be more relevant than upwelling strength when considering some biological responses.
Both are provided at 1˚ resolution along the U.S. west coast (31-47˚N).
Download Indices
CUTI
Daily [csv] [NetCDF]
Monthly [csv] [NetCDF]BEUTI
Daily [csv] [NetCDF]
Monthly [csv] [NetCDF]For use in publications, please cite:
Jacox MG, CA Edwards, EL Hazen, SJ Bograd (2018) Coastal upwelling revisited: Ekman, Bakun, and improved upwelling indices for the U.S. west coast, J. Geophysical Research, 123(10), 7332-7350. [pdf]


Additional information and guidance
How is CUTI calculated?
CUTI is an estimate of vertical transport into (or out of) the surface mixed layer. It is calculated from surface wind stress, sea surface height, and mixed layer depth, each derived from a regional ocean reanalysis (i.e., an ocean model that assimilates available data from satellites and in situ platforms).
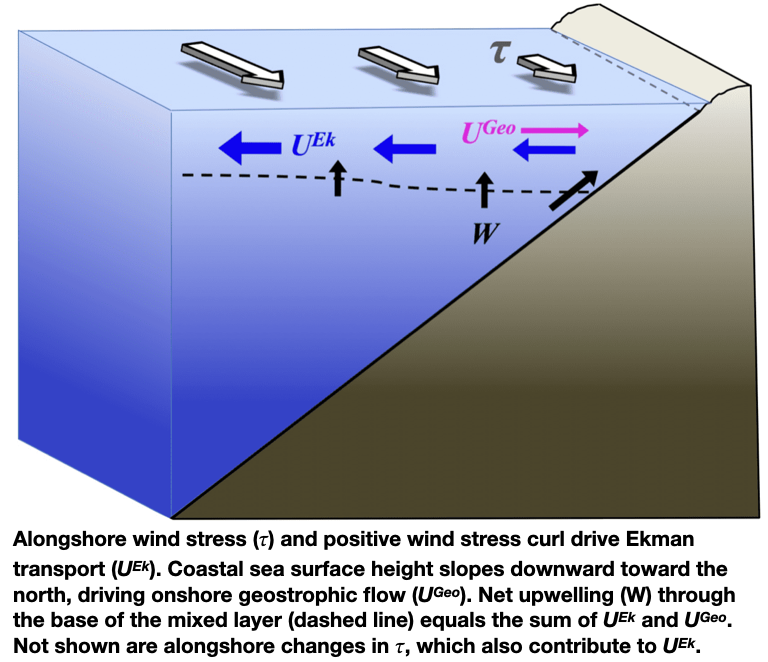
CUTI estimates total vertical transport through the base of the mixed layer (W) as the sum of two components:
(1) Vertical transport due to divergence or convergence in near-surface Ekman transport (UEk), which is driven by alongshore winds as well as wind stress curl.
(2) Vertical transport associated with cross-shore geostrophic transport (UGeo), associated with an alongshore pressure gradient.
CUTI is calculated for 1˚ latitude bins (31-47˚N), each extending 75 km offshore. UEk and UGeo are integrated along the northern, western, and southern boundaries bin. Then, CUTI = UEk + UGeo.
How is BEUTI calculated?
BEUTI is an estimate of nitrate flux into (or out of) the surface mixed layer. It is obtained by multiplying vertical transport at the base of the mixed layer by nitrate concentration at the base of the mixed layer: BEUTI = CUTI * [NO3–]MLD.
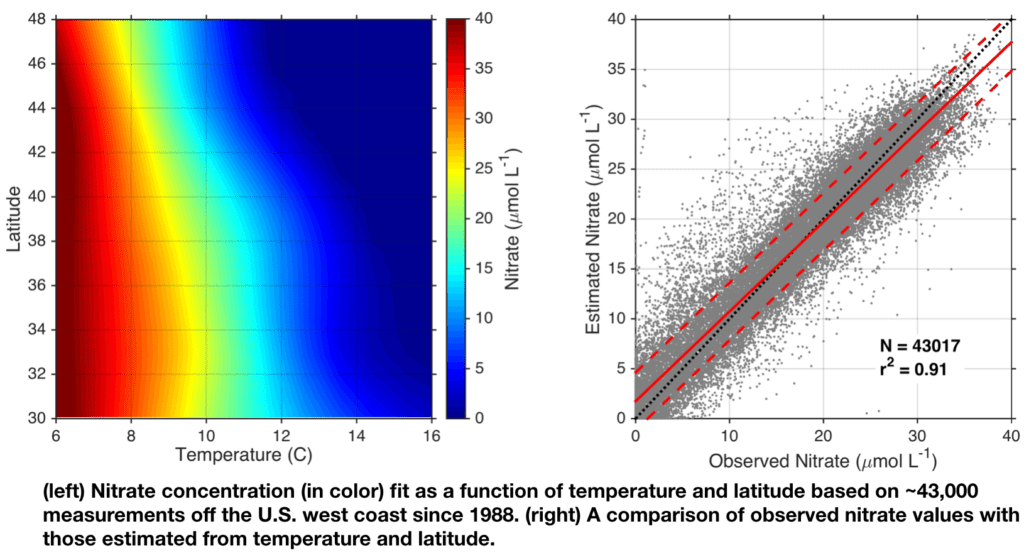
CUTI is calculated as described above, and nitrate concentration at the base of the mixed layer is estimated from the ocean reanalysis by using temperature at the base of the mixed layer and latitude as input to a temperature-latitude-nitrate relationship (left panel). This relationship was developed based on over 43,000 nitrate measurements from multiple observational programs along the U.S. west coast, and it is very effective for estimating nitrate (right panel).
How are CUTI and BEUTI different from the Bakun Index?
Full details of the Bakun Index calculation are available in technical reports by Bakun [1973, 1975], and Schwing et al. [1996]. Details of the CUTI and BEUTI calculations and a thorough comparison with the Bakun Index are in Jacox et al. [2018]. Here we briefly review key differences between indices.
(1) The Bakun Index uses sea level pressure fields from an atmospheric reanalysis to derive estimated near-surface winds, while CUTI and BEUTI use winds directly from atmospheric reanalyses that assimilate satellite and in situ wind measurements.
(2) CUTI and BEUTI fully account for upwelling driven by wind stress curl, while the Bakun Index does not. Specifically, it omits upwelling associated with alongshore changes in the wind.
(3) CUTI and BEUTI account for cross-shore geostrophic transport, which can suppress or enhance upwelling relative to the wind-driven Ekman transport, while the Bakun Index does not.
(4) BEUTI estimates not just the volume transport of upwelling/downwelling, but also the amount of nitrate being upwelled/downwelled. Neither CUTI nor the Bakun Index consider the properties of upwelled water.
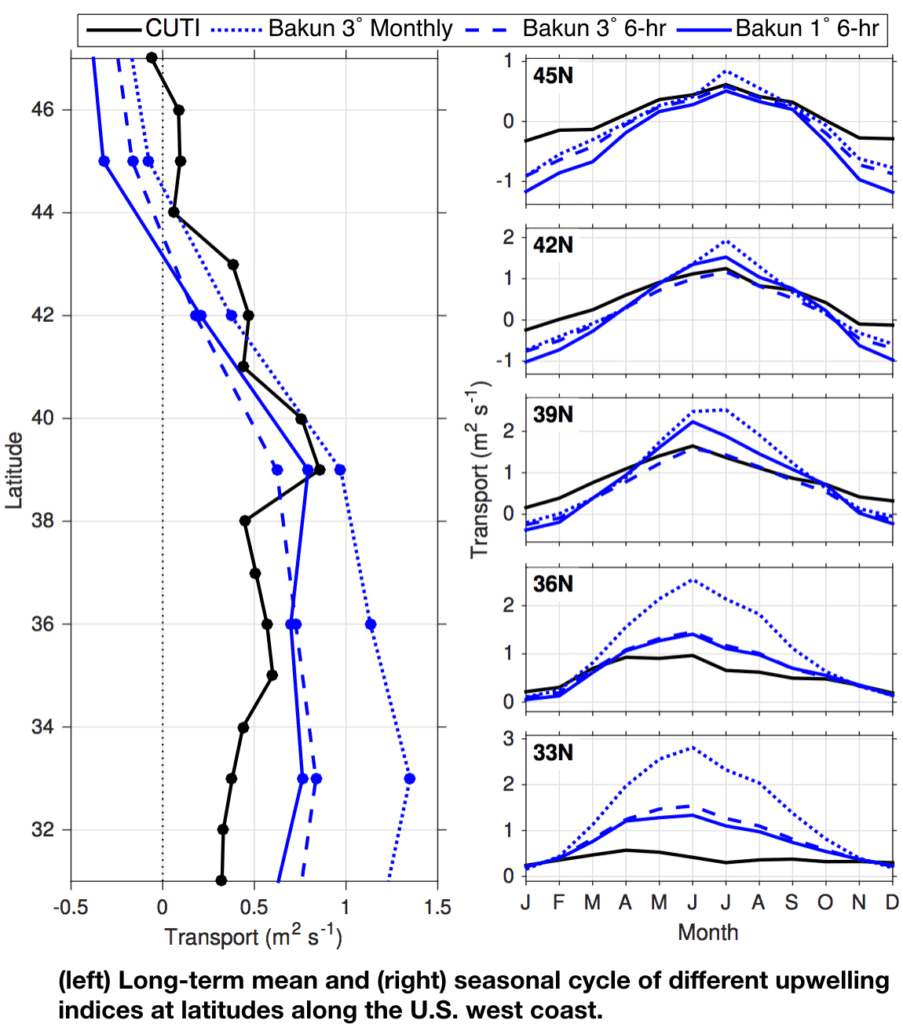
Differences between CUTI and the Bakun Index are clearly visible in their long-term means and seasonal cycles at latitudes spanning the U.S. west coast (see figure at right). Note that several versions of the Bakun Index have been created throughout the years, as there have been periodic changes to the sea level pressure fields used to generate them. They are referred to here as 3˚ monthly, 3˚ 6-hourly, and 1˚ 6-hourly, after the spatial and temporal resolutions of the sea level pressure fields used to derive them.
Differences in mean transport estimates are especially pronounced off southern and central California, where Bakun [1973] pointed out that limitations of using relatively coarse-resolution sea level pressure fields to estimates near-surface winds. In the seasonal cycle, the Bakun Index tends to give much higher estimates of transport magnitude, particularly for winter downwelling in the north and summer upwelling in the south. This is in part because it does not account for cross-shore geostrophic transport, which tends to oppose Ekman transport and reduce the upwelling/downwelling magnitude.
Note that while points (1)-(4) above relate to simplifications in the Bakun Index that have been addressed by CUTI and/or BEUTI, the advantage to those simplifications is that they allow relatively straightforward calculation of the Bakun Index extending further back in time and over a broader spatial domain.
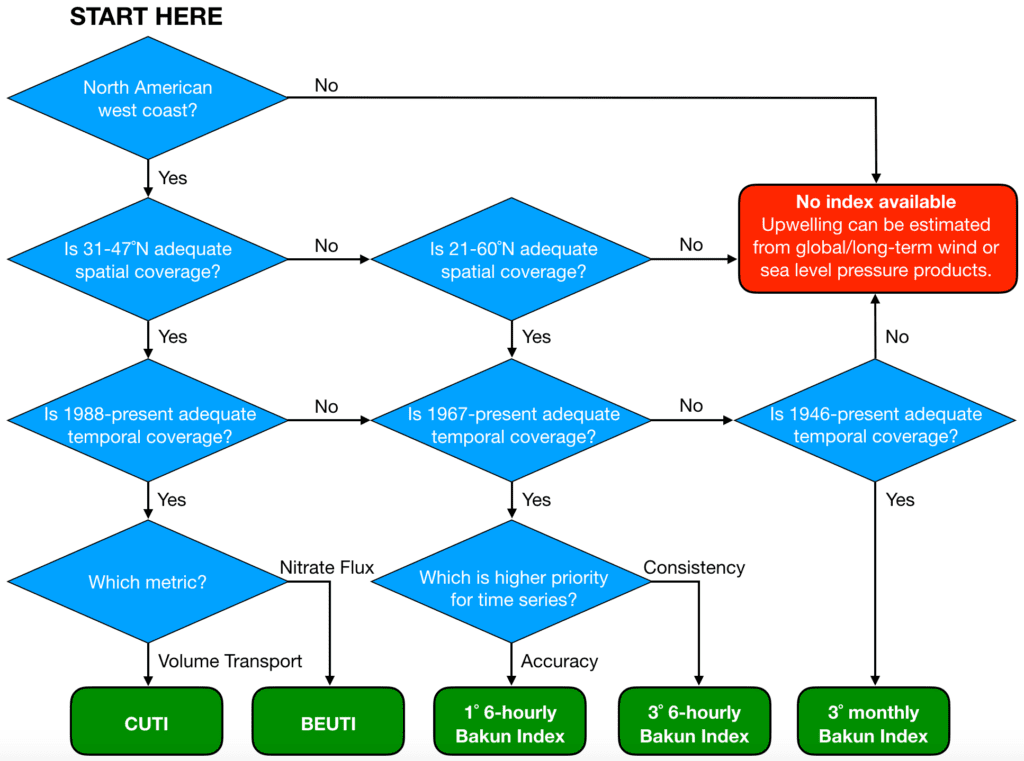
Which index should I use?
Use the chart below to find the appropriate index based on spatiotemporal coverage and attributes of the time series. In general, CUTI and/or BEUTI should be used if they cover the spatial domain and time period of interest. Otherwise, various versions of the Bakun Index can be used (available here).
Note that the different Bakun Indices are quite similar north of 39˚N, but farther south the different indices diverge and the choice of which to use becomes more important (see comparison above under “How are CUTI and BEUTI different from the Bakun Index?”).
CUTI and BEUTI were developed in the Environmental Research Division of NOAA’s Southwest Fisheries Science Center, in collaboration with the UC Santa Cruz Ocean Modeling Group.